Haiti America Map Reality: Where Haitian Immigrants Actually Live in the US Today
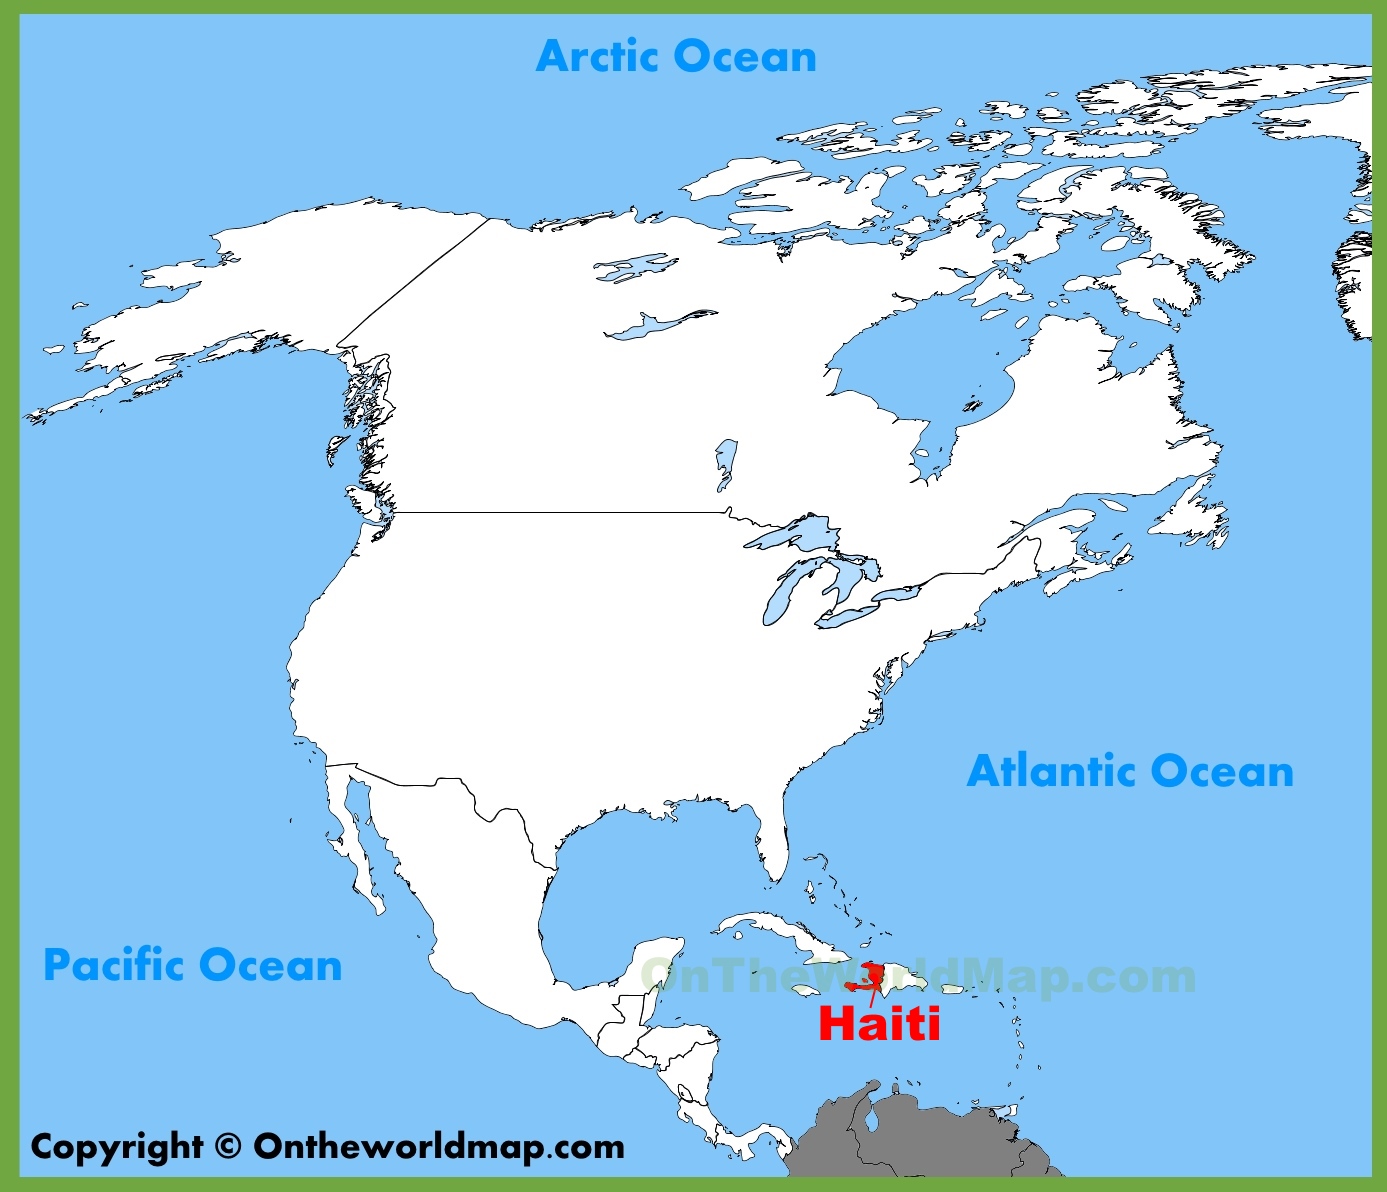
Haiti America Map Reality: Where Haitian Immigrants Actually Live in the US Today
Viral infographics depicting the geographical footprint of Haitian immigrants across the United States have taken over social feeds, spurred by heated national debates over federal immigration policy and legal protections. Broadcast networks and investigative outlets, including a detailed WBAL-TV Report and rolling coverage from Newsweek, have tracked how state-by-state migration data suddenly became central to public arguments surrounding the termination of Temporary Protected Status (TPS). These maps often present stark heat points, yet the underlying reality of Caribbean diaspora geography tells a far more nuanced story of labor economics, generational roots, and targeted industrial recruitment.
Beneath the polarized online commentary lies decades of demographic movement. The Haitian diaspora in the United States comprises roughly 1.1 million to 1.2 million individuals, counting both foreign-born residents and people of Haitian ancestry. While viral maps often paint an image of sudden, widespread dispersal into every corner of the country, real settlement data shows that nearly three-quarters of the entire population remains concentrated in just a handful of metropolitan regions.
📌 Key Takeaways:
- Geographic Concentration: Florida and New York account for more than 65% of the total Haitian immigrant population in the United States, anchored by decades-old hubs in Miami, Broward County, Brooklyn, and Queens.
- Policy Exposure: An estimated 200,000 to 300,000 individuals rely directly on Temporary Protected Status (TPS), leaving regional labor forces vulnerable to sudden administrative policy terminations.
- New Resettlement Nodes: Secondary migration to midwestern cities like Springfield, Ohio, and Charleroi, Pennsylvania, was driven by manufacturing labor shortages rather than random border dispersion.
The Viral Maps and the Political Catalyst
Visual representations of immigrant distributions carry immense rhetorical power. Over the past year, simplified map graphics showing state-level Haitian populations surged across X, TikTok, and Reddit, frequently stripped of historical context. Many of these viral graphics highlighted sudden statistical spikes in non-traditional states, prompting alarmist narratives or defensive political rhetoric. The catalyst behind this renewed scrutiny was the contentious debate over the executive branch's moves toward TPS policy termination, which directly threatens the legal work authorization and deportation relief of hundreds of thousands of Caribbean nationals.
When policy announcements signaled an end to blanket protections, researchers and journalists began mapping the human fallout. Local economies from South Florida to the Rust Belt realized that thousands of essential healthcare workers, logistics technicians, and manufacturing laborers held active TPS documentation. Public interest exploded. People wanted to know where Haitian communities actually lived, how long they had been there, and why specific inland towns suddenly appeared as distinct demographic focal points alongside traditional coastal gateways.
What the Census Migration Data Actually Shows
According to US Census migration data and the American Community Survey, the foreign-born Haitian population is one of the most geographically concentrated immigrant groups in North America. Contrary to claims that the population is evenly or unpredictably scattered nationwide, the physical reality follows established institutional, linguistic, and familial corridors. South Florida remains the undisputed center of gravity, home to roughly 48% of all Haitian immigrants in the country.
The northeastern corridor represents the second major axis. New York and Massachusetts together house roughly 26% of the population, establishing cultural anchors in Flatbush, Brooklyn, and the urban core of Greater Boston. States across the American West and Deep South register negligible percentages. Outside of a few distinct industrial recruitment pockets in Georgia, North Carolina, and Ohio, the vast interior of the US immigration map contains very small, dispersed populations of Haitian heritage.
Historical Coastal Gateways vs. Industrial Resettlement Corridors
Understanding Caribbean diaspora geography requires separating historic entry points from modern secondary migration corridors. The foundation of the diaspora was built during the late 20th century, as political instability and economic hardship pushed families toward maritime transit corridors into Florida and direct commercial flight pathways into New York City.
| State / Region | Est. Haitian-Born Population | Primary Anchor Communities | Primary Economic Sectors |
|---|---|---|---|
| Florida | 360,000, 390,000 | Little Haiti (Miami), North Miami, Broward, Palm Beach | Healthcare, Hospitality, Construction, Airport Logistics |
| New York | 130,000, 145,000 | Flatbush, Crown Heights, Queens Village, Spring Valley | Nursing/Home Care, Public Transit, Social Services |
| Massachusetts | 45,000, 55,000 | Mattapan, Dorchester, Brockton, Cambridge | Biotech Services, Clinical Healthcare, Higher Education |
| New Jersey | 30,000, 40,000 | East Orange, Irvington, Newark, Elizabeth | Warehousing, Transportation, Clinical Support |
| Ohio (Emerging) | 12,000, 18,000 | Springfield, Columbus, Dayton | Assembly Plants, Food Processing, Distribution Centers |
Florida Haitian communities have developed intricate civil infrastructure across half a century. Little Haiti in Miami, alongside sprawling neighborhoods in North Miami, Lauderdale Lakes, and Boynton Beach, features dedicated Creole-language radio programming, commercial plazas, and faith-based mutual aid societies. These enclaves act as economic shock absorbers for new arrivals, offering informal safety nets and employment pathways that inland locations lack.
In contrast, the New York Haitian population and Massachusetts immigrant demographics reflect deep institutional integration within public sector and municipal frameworks. In places like Brockton, Massachusetts, and Rockland County, New York, second- and third-generation Haitian Americans hold legislative seats, run school boards, and operate established community credit unions. The settlement pattern here is generational and permanent.
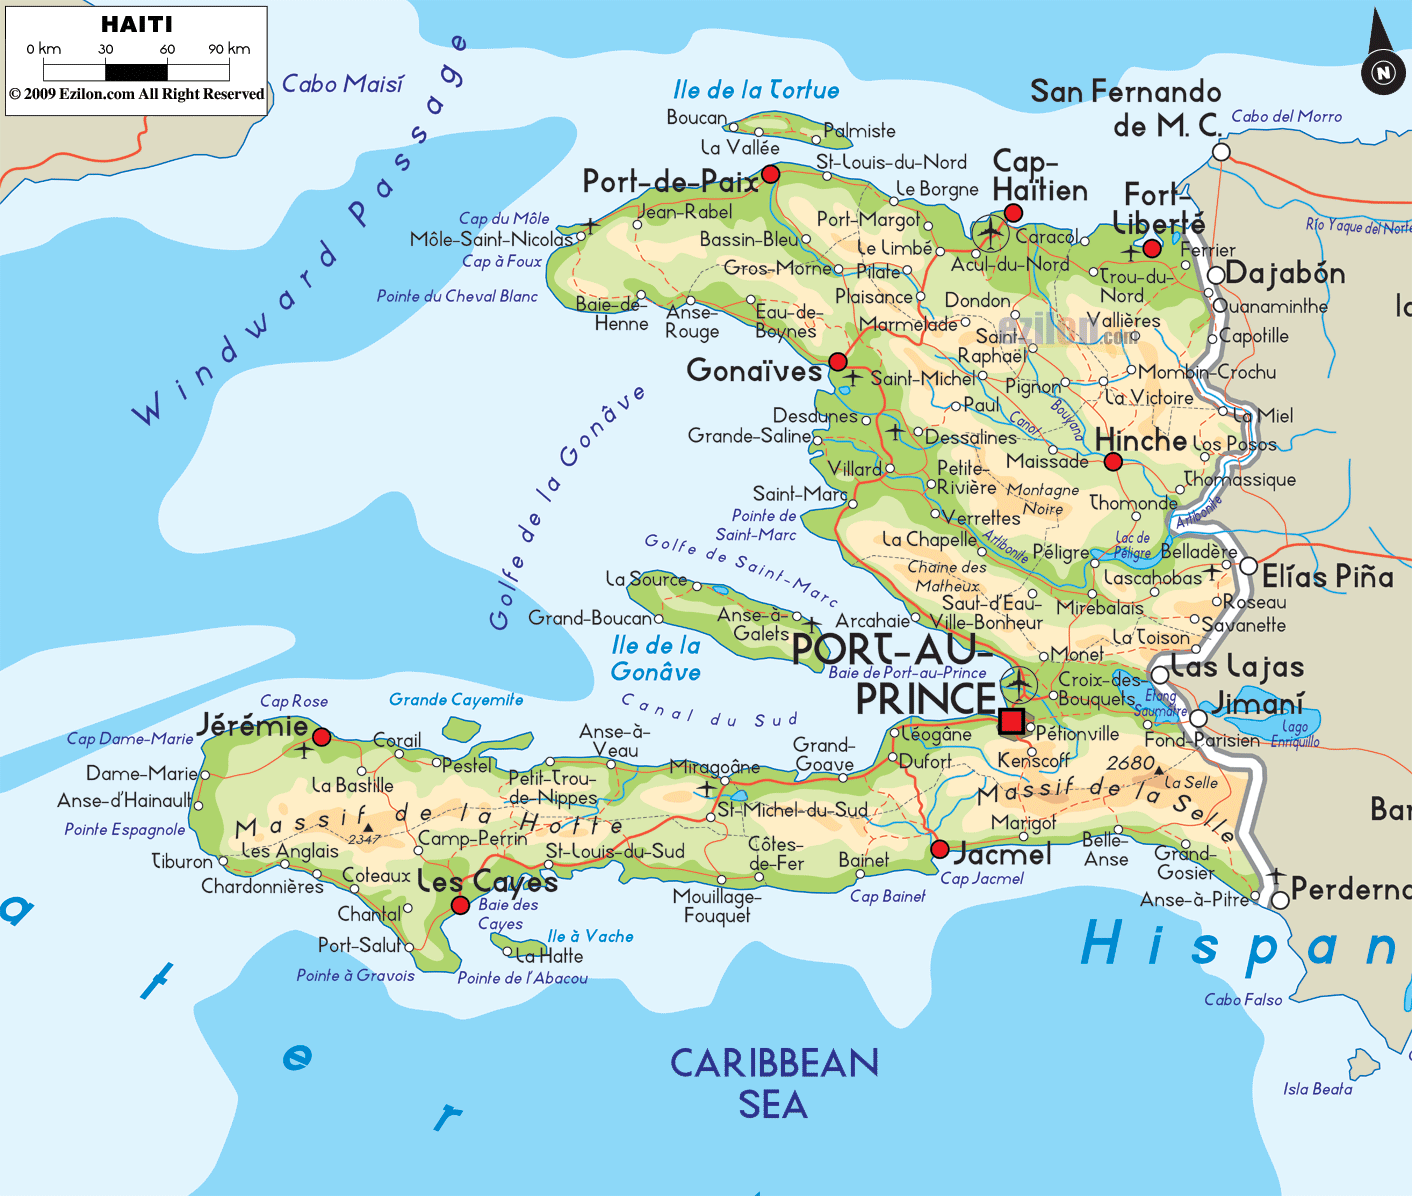
The Mechanics of Midwestern Resettlement: Why Springfield Happened
The intense spotlight on the Springfield Ohio Haitian community revealed an entirely different mechanism: corporate-driven secondary migration. Between 2020 and 2024, thousands of Haitian immigrants who initially processed through Florida or southern border entry points relocated to southwestern Ohio. This was not an unguided movement. It was a rational response to economic demand.
Midwestern industrial operations faced acute labor shortages following the pandemic. Packaging facilities, auto parts suppliers, and food production plants in Clark County could not fill entry-level shifts with local labor pools. Staffing agencies recruited legal Haitian immigrants holding valid TPS or humanitarian parole documentation, offering stable hourly wages and significantly lower housing costs compared to South Florida or Brooklyn. The resulting demographic shift revitalized local assembly lines but strained municipal services, translation services in public schools, and local healthcare infrastructure that had never planned for rapid demographic growth.
The Economic Reality of TPS Policy Termination
The prospect of TPS policy termination introduces stark economic uncertainties that go far beyond immigration court dockets. Temporary Protected Status confers legal authority to work; it does not grant permanent residency or citizenship. When TPS is curtailed, holders lose their ability to work legally, pay payroll taxes under verified Social Security numbers, and hold valid driver's licenses.
In regional economies heavily reliant on this labor pool, the impact would be felt almost immediately. In South Florida's assisted living centers, Haitian certified nursing assistants (CNAs) represent a primary segment of the caregiving workforce. In the distribution hubs of northern New Jersey and central Ohio, logistics operations run on legal immigrant shifts. Abrupt revocations force workers into the informal economy, lower tax revenues for municipal budgets, and trigger costly turnover for industrial employers who spent years onboarding authorized workers.
Frequently Asked Questions (FAQ)
Q1: Why did Haitian immigrants move to small midwestern towns instead of staying in Florida?
A1: High costs of living and expensive rental markets in South Florida drove families inland, where manufacturing facilities and distribution centers offered steady wages and affordable housing.
Q2: What legal status do most Haitian immigrants on these maps hold?
A2: The population holds diverse legal statuses, ranging from naturalized US citizenship and lawful permanent residency (green cards) to humanitarian parole and Temporary Protected Status (TPS).
Q3: How many Haitian people in the US currently rely on TPS?
A3: Estimates vary between 200,000 and 300,000 individuals, depending on specific designation dates and pending administrative renewal cycles.
Q4: Do the viral maps accurately show undocumented border crossings?
A4: No. Most viral maps conflate the total diaspora, including US-born citizens and green card holders who have lived in the country for decades, with recent border arrivals, distorting the actual demographic footprint.
Navigating the Demographic Map Beyond 2026
The geography of Haitian migration across the United States is fundamentally defined by economic utility and family ties. Visual representations that isolate small inland communities without showing the massive, fifty-year-old anchors in South Florida, New York, and Massachusetts distort the reality of how diaspora communities form and function. Industrial centers in the Rust Belt recruited immigrant labor because their local economies needed operational hands, while traditional coastal communities continue to absorb shifting federal policies through entrenched civic networks.
As federal courts and administrative agencies determine the future of Temporary Protected Status, the debate must remain grounded in actual demographic data. Disrupting legal work authorizations does not simply redraw a map; it destabilizes local healthcare systems, assembly plants, and tax bases that depend daily on these workers. Clear data, rather than sensational viral infographics, provides the only reliable guide for evaluating the true impact of Caribbean migration on the American landscape.